TSNN Top 250 Trade Show List Data Visualization Developed by Bear Analytics

TSNN’s annual report on the Top 250 Trade Shows is an industry standard that is used by trade show producers to benchmark show performance and as a resource to industry suppliers.
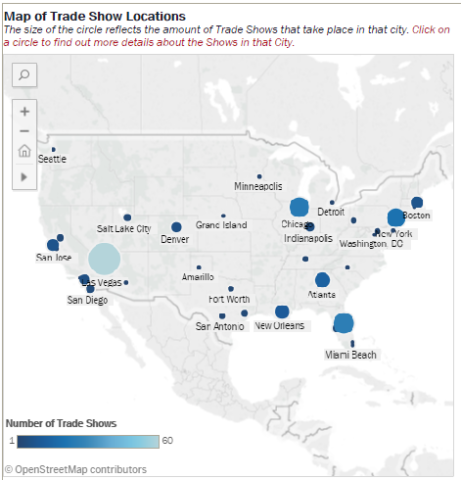
Bear Analytics and TSNN have now taken the rich Trade Show performance dataset and created a series of Top 250 performance dashboards that allow users to interact with the data, draw comparisons, and explore the trends driving the industry’s top Trade Shows.
“The TSNN Top 250 Trade Show list ranks the top shows by net square footage,” said TSNN President Rachel Wimberly. “Bear Analytics was able to take this prestigious list and use data visualization to bring it to life an exciting and dynamic way. We hope readers enjoy finding out more about the shows, cities and overall trends featured on Top 250 list dashboards.”
These dashboards are best viewed on your desktop. Please use the text in red to guide you through the interactive features of each dashboard.
HERE is the link to the TSNN Top 250 Trade Show/Bear Analytics Dashboard
3 Ways to Look at the Data
2014 versus 2015 Topline Analysis: Explore how the Trade Show industry performed in 2015 compared to 2014. Compare changes in attendance within each host city and industry. You can also see what time of year is the most popular to host large Trade Shows.
2014 and 2015 In Depth Analysis: Use these dashboards to look at how individual shows stack up in terms of number of attendees, exhibitors and other metrics. You can customize the view by Time of Year, Industry, and City.
Individual Trade Show Growth Analysis: View all of the shows that made the TSNN Top 250 List in 2014 and 2015 and look at how their overall rankings and metrics have changed. You can also see if the show stayed in the same location or changed location over the two years.


Add new comment